
This blog is a by-product of a recent project to investigate and validate the sequence of events on some electrical Switchgear where the SCADA and Switchgear communicate over PROFIBUS DP. This was done by examining what was happening “on the PROFIBUS wire” (Actually PROFIBUS DP has two wires, a red one and a green one!).
It also brought into focus the idea that analysis of process data as it appears “on the wire” could have many operational and maintenance benefits – achieved without additional loading or complication for the associated SCADA.
While it is true that modern field-bus and industrial Ethernet systems support the use of intelligent field devices which can provide access to configuration and diagnostic information via FDT and similar engineering tools there is an effortless simplicity to gaining insight on the wire through independent means. This is especially true when comparing events from different sensors or items of equipment to determine cause-and-effect relationships and accurate time sequencing.
Now we go back to the actual investigation. An intermittent logic fault reported by the SCADA suggested that the feedback from Switch-gear contactors was sometimes reported in the wrong sequence causing incorrect operation. By recording data change at the wire level we were to monitor the behaviour of ten pumps which all shared a common IO template and test this hypothesis.
The pumps all had an IO template as shown below:
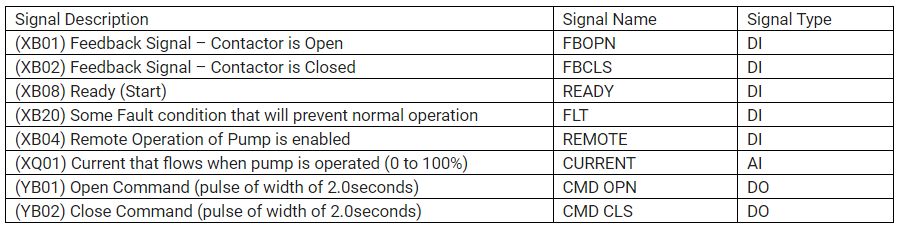
Before starting a pump
If we view what happens on the PROFIBUS wire over a period when a pump is started and then stopped we expect to find initially (an idle pump in the “off” state):
(INPUTS)
FBOPN = 1
This implies that the pump is stopped (not energised).
FBCLS = 0
This implies that the pump is stopped (not energised).
READY = 1
This indicates that the pump is available to be started.
FLT = 0
This indicates that there is no local fault that might prevent the operation.
REMOTE = 1
This indicates that the SCADA is enabled to operate the pump.
CURRENT = 0
As the pump is stopped there is no current.
(OUTPUTS)
CMD OPN = 0
There is no active command to stop.
CMD CLS = 0
There is no active command to start.
When starting a pump
When a pump is requested to start we expect to see a 2-second duration pulse, ⸥⸺⸤ (0 to 1 and then 1 to 0 transition) on CMD CLS which will cause:
(INPUTS)
FBOPN = 0
This implies that the pump is now started (energised).
FBCLS = 1
This implies that the pump is now started (energised).
READY = 0
This implies that the pump is started (energised) or is not able to start.
REMOTE = 1
This indicates that the SCADA is enabled to operate the pump (does not change).
CURRENT > 0
For a few hundred milliseconds there will be a high start-up current before the current drops back into the normal operating range ( 0 > CURRENT <= 100).
(OUTPUTS)
CMD OPN = 0
There is no active command to stop.
CMD CLS = 0
After the 2-second-wide pulse, there will be no active command present.
During normal pump operation the value for CURRENT changes while all other signals remain in the same state (as above).
When stopping a pump
When a pump is requested to stop we expect to see a 2-second duration pulse, ⸥⸺⸤ (0 to 1 and then 1 to 0 transition) on CMD OPN which will cause:
(INPUTS)
FBOPN = 1
This implies that the pump is stopped (not energised) and was previously 0.
FBCLS = 0
This implies that the pump is stopped (not energised) was previously 1.
READY = 1
This indicates that the pump is again available to be started – it was previously 0.
FLT = 0
This indicates that there is no local fault that might prevent operation (unchanged).
REMOTE = 1
This indicates that the SCADA is enabled to operate the pump (unchanged).
CURRENT = 0
Within one or two scans, there is no current as the pump is stopped.
(OUTPUTS)
CMD OPN = 0
After the 2-second active pulse has been completed the signal returns to zero.
CMD CLS = 0
There is no active command to start.
This expected sequence is described below.
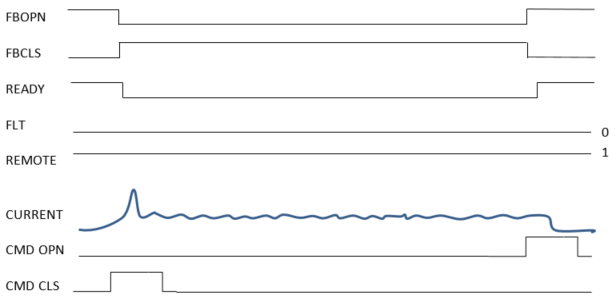
The expected sequence for pump starting, running and stopping. By comparing the sequence of events occurring on the wire with the event log produced by the SCADA system we expected to correlate and explain (where possible) the behaviour that was observed.
Our approach was to passively listen on the PROFIBUS network and capture the traffic between the SCADA and the Switch-gear, knowing that the commands would be contained in the CYCLIC DATA EXCHANGE OUPUT issued by the SCADA to the Switch-gear and that all the feedback would be contained in the CYCLIC DATA EXCHANGE INPUT received by the SCADA from the Switch-gear. Also by creating filters to watch for specific data changes, we could limit the amount of data that we needed to record.
As the intermittent error conditions could be days apart we chose to install a monitor at the remote site and then upload the recorded data to our office where we developed an offline tool for analysis and reporting – a tool that created a simple text log of when signals changed and the duration of time that had elapsed before the change occurred. It also created an Excel spreadsheet that showed the state of all related signals for every DATA EXCHANGE message that contained any data that had changed.
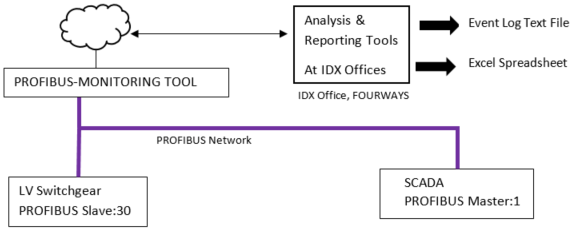
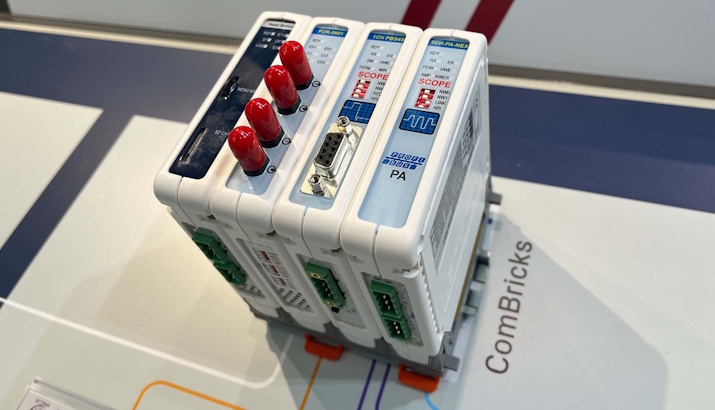
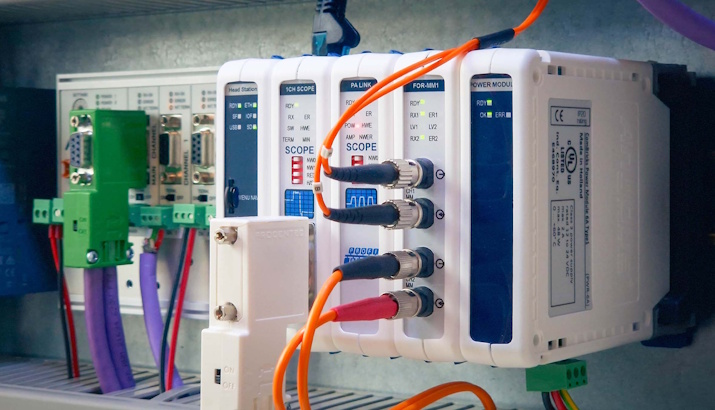
PROFIBUS monitoring tool with remote monitoring
The PROFIBUS monitoring tool made use of PROCENTEC PROFITRACE to connect passively to the PROFIBUS network and to log the data to disk.
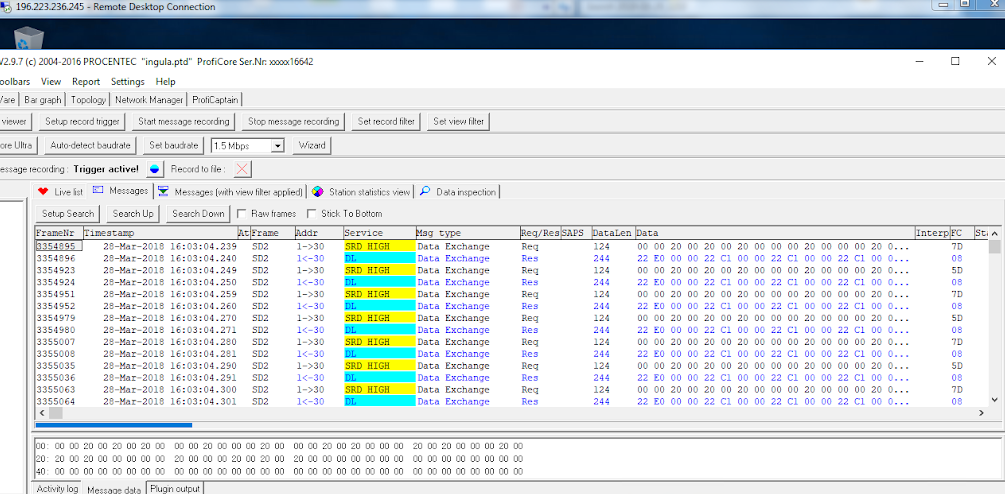
The above screen shows a filtered view of recorded PROFIBUS messages that contain the I/O data exchanged between the PLC controller (Station Address:1) and the LV Switch-gear PROFIBUS device (Station Address:30).
All outputs from PLC are exchanged in a single message (SRD HIGH) while the inputs from the LV Switch-gear are exchanged in a single message (DL). From the I/O Schedule, it is possible to extract the I/O for each pump analyse when values change and measure the duration of time before a change occurs.
The next picture (an extract from an Excel spreadsheet report for one of the pumps highlights normal expected behaviour from just before a START until just after a STOP.
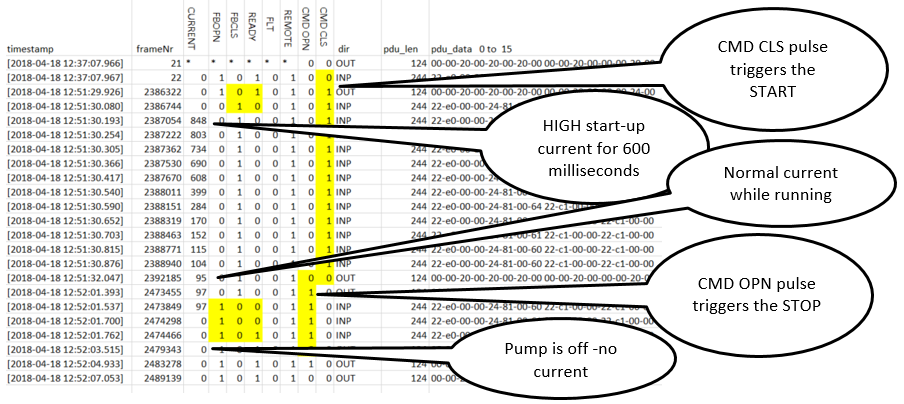
An example of an Excel Spreadsheet produced for a pump operation: start, high-current, normal current, and stop
The idea of a general purpose tool for operational understanding
This blog will not go into any detail on the project findings but will rather indicate what the author saw as a general-purpose tool and benefit from passive listening on the wire (in this case PROFIBUS but it could be MODBUS or some industrial Ethernet) independent of the host SCADA system.
Listening on the wire, independently, provides a single accurate version of what information was shared between the SCADA and Switchgear Station – with timing and detail at the same resolution of raw information transfer. When high-level systems log and report events there is no guarantee that they have the same accuracy as they may be subject to slower cycle times and asynchronous task execution and reporting.
Determination of the exact sequence of events is made possible. Changes in feedback can only be reported with the INP message while commands are only transferred in OUT messages. This makes a sequence of event analysis straightforward. What was very insightful was the high-speed-capture of the start-up current which could be as much as ten times the normal operating current.
As these start-up currents are very short in duration, a few hundred milliseconds, it is possible that they are typically not seen in any SCADA logs. This suggests that very useful statistics and profiles of start and stop operations could be captured in this way and be provided to asset optimisation and equipment maintenance applications for analysis and operational intervention. This can be achieved without any load on the SCADA and by not requiring the SCADA to have much faster scans to capture these transients.
Hence there is a real sense that this type of non-intrusive data recording and analysis may have many valid use cases – suggesting that there is more to PROFIBUS diagnostic monitoring than just the statistics of physical network faults and configuration issues – what the data is doing on the wire may provide useful insights not easily acquired from SCADA or the PlantData Historian that typically receives its data from the SCADA.